Circle
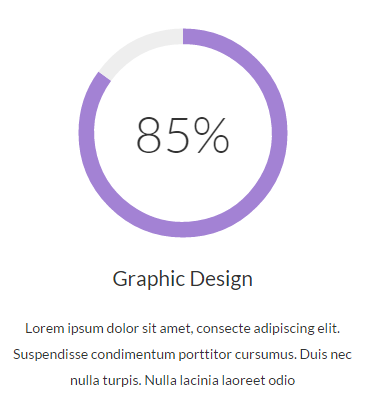
Chart – Circle
HTML markup:
|
1 2 3 4 5 6 7 8 9 10 11 12 13 14 15 16 17 18 |
<div class="ct-graphBox ct-graphBox--default"> <div class="ct-graphBox-graph"> <canvas width="150" height="150" class="ct-js-pieChart" data-ct-percentage="85" data-ct-middleSpace="85" data-ct-secondColor="#eeeeee" data-ct-firstColor="#a382d4"></canvas> <span class="ct-graphBox-graphPercentage">85%</span> </div> <div class="ct-graphBox-content"> <h4 class="ct-graphBox-title"> Graphic Design </h4> <p> Lorem ipsum dolor sit amet, consecte adipiscing elit. Suspendisse condimentum porttitor cursumus. Duis nec nulla turpis. Nulla lacinia laoreet odio </p> </div> </div> |
Script:
|
1 2 |
<script src="assets/js/charts/Chart.min.js"></script> <script src="assets/js/charts/init.js"></script> |
Bar

Chart – Bar
HTML markup:
|
1 |
<canvas id="barchart" height="450" width="600"></canvas> |
Script:
|
1 2 3 4 5 6 7 8 9 10 11 12 13 14 15 16 17 18 19 20 21 22 23 24 25 26 27 28 29 30 31 32 33 34 35 |
<script src="assets/js/charts/Chart.min.js"></script> <script src="assets/js/charts/init.js"></script> <script> var randomScalingFactor = function () { return Math.round(Math.random() * 100) }; var barChartData = { labels: ["January", "February", "March", "April", "May", "June", "July"], datasets: [ { fillColor: "rgba(252,67,73,0.5)", strokeColor: "#fc4349", highlightFill: "#fc4349", highlightStroke: "#fc4349", data: [randomScalingFactor(), randomScalingFactor(), randomScalingFactor(), randomScalingFactor(), randomScalingFactor(), randomScalingFactor(), randomScalingFactor()] }, { fillColor: "rgba(173,210,96,0.5)", strokeColor: "#add260", highlightFill: "#add260", highlightStroke: "#add260", data: [randomScalingFactor(), randomScalingFactor(), randomScalingFactor(), randomScalingFactor(), randomScalingFactor(), randomScalingFactor(), randomScalingFactor()] } ] } window.onload = function () { var ctx1 = document.getElementById("barchart").getContext("2d"); window.myBar = new Chart(ctx1).Bar(barChartData, { responsive: true } </script> |
Line
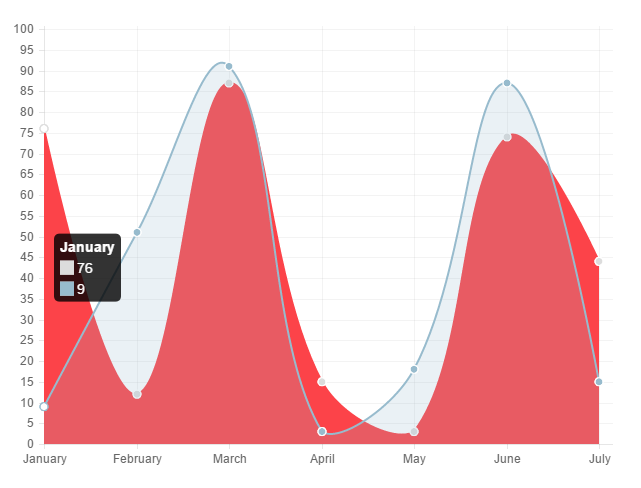
Chart – Line
HTML markup:
|
1 |
<canvas id="polararea" height="450" width="600"></canvas> |
Edit all values with Javascript:
|
1 2 3 4 5 6 7 8 9 10 11 12 13 14 15 16 17 18 19 20 21 22 23 24 25 26 27 28 29 30 31 32 33 34 35 36 37 38 39 40 41 42 43 44 |
<script src="assets/js/charts/Chart.min.js"></script> <script src="assets/js/charts/init.js"></script> <script> var randomScalingFactor = function () { return Math.round(Math.random() * 100) }; var lineChartData = { labels: ["January", "February", "March", "April", "May", "June", "July"], datasets: [ { label: "My First dataset", fillColor: "#fc4349", strokeColor: "#fc4349", highlightFill: "#fc4349", highlightStroke: "#fc4349", pointColor: "rgba(220,220,220,1)", pointStrokeColor: "#fff", pointHighlightFill: "#fff", pointHighlightStroke: "rgba(220,220,220,1)", data: [randomScalingFactor(), randomScalingFactor(), randomScalingFactor(), randomScalingFactor(), randomScalingFactor(), randomScalingFactor(), randomScalingFactor()] }, { label: "My Second dataset", fillColor: "rgba(151,187,205,0.2)", strokeColor: "rgba(151,187,205,1)", pointColor: "rgba(151,187,205,1)", pointStrokeColor: "#fff", pointHighlightFill: "#fff", pointHighlightStroke: "rgba(151,187,205,1)", data: [randomScalingFactor(), randomScalingFactor(), randomScalingFactor(), randomScalingFactor(), randomScalingFactor(), randomScalingFactor(), randomScalingFactor()] } ] } window.onload = function () { var ctx2 = document.getElementById("linechart").getContext("2d"); window.myLine = new Chart(ctx2).Line(lineChartData, { responsive: true }); } </script> |
Polar
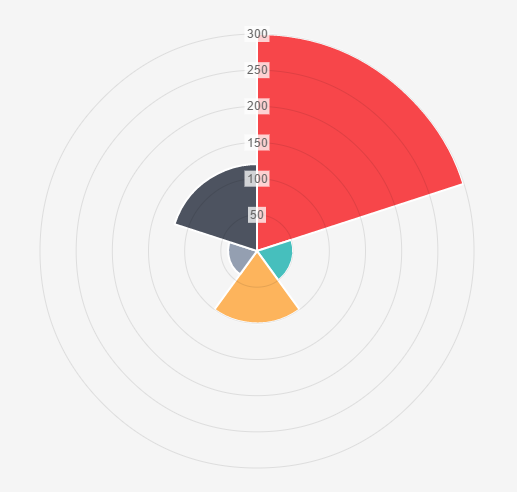
Chart – Polar
HTML markup:
|
1 |
<canvas id="polararea" height="450" width="600"></canvas> |
Script:
|
1 2 3 4 5 6 7 8 9 10 11 12 13 14 15 16 17 18 19 20 21 22 23 24 25 26 27 28 29 30 31 32 33 34 35 36 37 38 39 40 41 42 43 44 45 46 47 48 49 50 |
<script src="assets/js/charts/Chart.min.js"></script> <script src="assets/js/charts/init.js"></script> <script> var randomScalingFactor = function () { return Math.round(Math.random() * 100) }; var polarData = [ { value: 300, color: "#F7464A", highlight: "#FF5A5E", label: "Red" }, { value: 50, color: "#46BFBD", highlight: "#5AD3D1", label: "Green" }, { value: 100, color: "#FDB45C", highlight: "#FFC870", label: "Yellow" }, { value: 40, color: "#949FB1", highlight: "#A8B3C5", label: "Grey" }, { value: 120, color: "#4D5360", highlight: "#616774", label: "Dark Grey" } ]; window.onload = function () { var ctx3 = document.getElementById("polararea").getContext("2d"); window.myPolarArea = new Chart(ctx3).PolarArea(polarData, { responsive: true } </script> |