Line chart
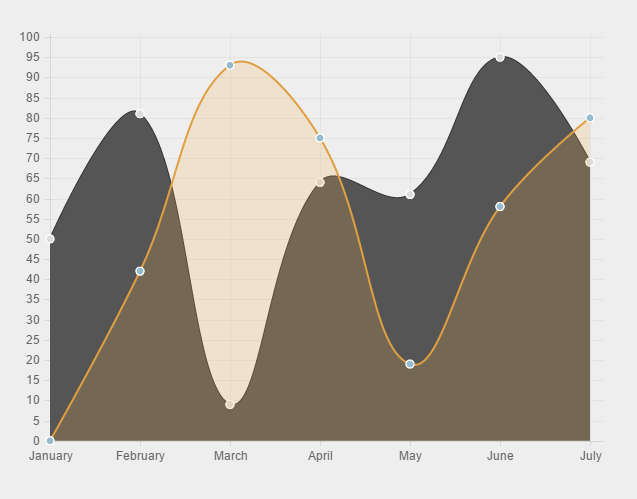
line-chart
HTML markup:
|
1 |
<canvas id="linechart" height="450" width="600"></canvas> |
Javascript code:
|
1 2 3 4 5 6 7 8 9 10 11 12 13 14 15 16 17 18 19 20 21 22 23 24 25 26 27 28 29 30 31 32 33 34 35 36 37 38 39 40 41 |
<script> var randomScalingFactor = function () { return Math.round(Math.random() * 100) }; var lineChartData = { labels: ["January", "February", "March", "April", "May", "June", "July"], datasets: [ { label: "My First dataset", fillColor: "#555", strokeColor: "#333", highlightFill: "#222", highlightStroke: "#111", pointColor: "rgba(220,220,220,1)", pointStrokeColor: "#fff", pointHighlightFill: "#fff", pointHighlightStroke: "rgba(220,220,220,1)", data: [randomScalingFactor(), randomScalingFactor(), randomScalingFactor(), randomScalingFactor(), randomScalingFactor(), randomScalingFactor(), randomScalingFactor()] }, { label: "My Second dataset", fillColor: "rgba(240,173,78,0.2)", strokeColor: "rgba(222,157,63,1)", pointColor: "rgba(151,187,205,1)", pointStrokeColor: "#fff", pointHighlightFill: "#fff", pointHighlightStroke: "rgba(151,187,205,1)", data: [randomScalingFactor(), randomScalingFactor(), randomScalingFactor(), randomScalingFactor(), randomScalingFactor(), randomScalingFactor(), randomScalingFactor()] } ] } window.onload = function () { var ctx2 = document.getElementById("linechart").getContext("2d"); window.myLine = new Chart(ctx2).Line(lineChartData, { responsive: true }); } </script> |
Pie chart
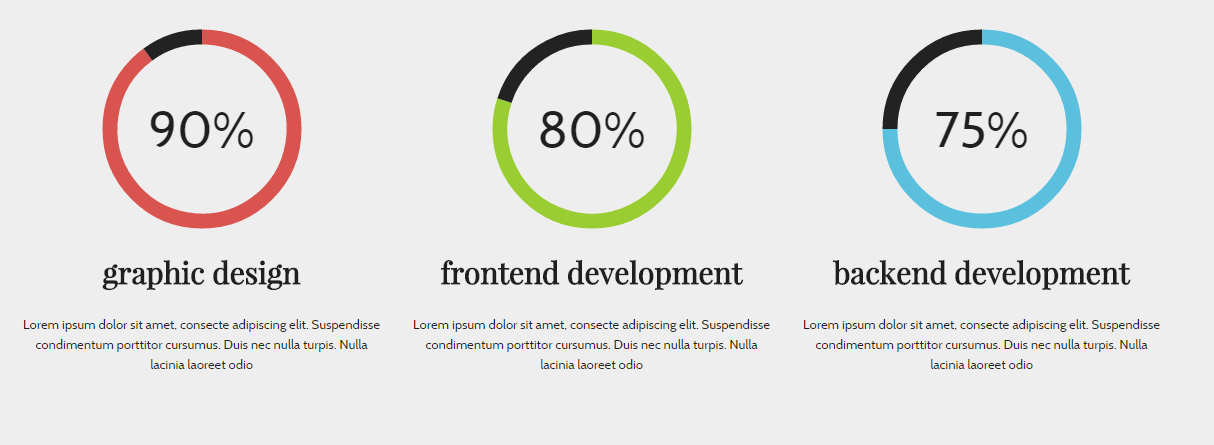
pie-chart
HTML markup:
|
1 2 3 4 5 6 7 8 9 10 11 12 13 14 15 16 17 18 |
<div class="ct-graphBox ct-graphBox--default"> <div class="ct-graphBox-graph"> <canvas width="150" height="150" class="ct-js-pieChart" data-ct-percentage="80" data-ct-middleSpace="85" data-ct-secondColor="#222222" data-ct-firstColor="yellowgreen"></canvas> <span class="ct-graphBox-graphPercentage">80%</span> </div> <div class="ct-graphBox-content"> <h4 class="ct-graphBox-title text-lowercase ct-fw-600"> Frontend development </h4> <p> Lorem ipsum dolor sit amet, consecte adipiscing elit. Suspendisse condimentum porttitor cursumus. Duis nec nulla turpis. Nulla lacinia laoreet odio </p> </div> </div> |
Bar chart
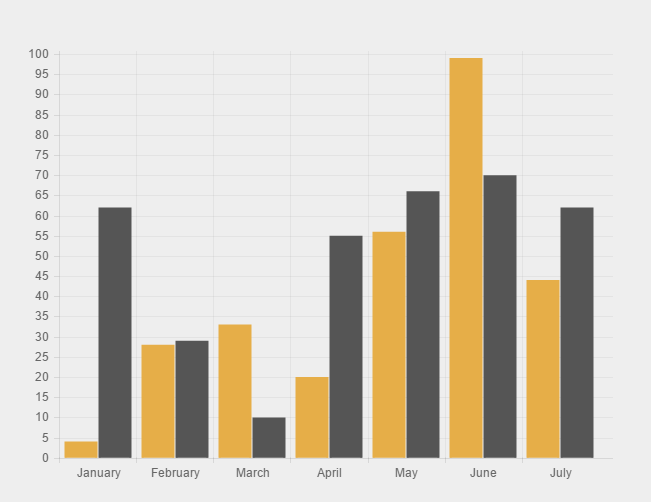
bar-chart
HTML markup:
|
1 |
<canvas id="barchart" height="450" width="600"></canvas> |
Javascript code:
|
1 2 3 4 5 6 7 8 9 10 11 12 13 14 15 16 17 18 19 20 21 22 23 24 25 26 27 28 29 30 31 32 33 |
<script> var randomScalingFactor = function () { return Math.round(Math.random() * 100) }; var barChartData = { labels: ["January", "February", "March", "April", "May", "June", "July"], datasets: [ { fillColor: "#e6ae48", strokeColor: "#e6ae48", highlightFill: "#f5af2f", highlightStroke: "#f5af2f", data: [randomScalingFactor(), randomScalingFactor(), randomScalingFactor(), randomScalingFactor(), randomScalingFactor(), randomScalingFactor(), randomScalingFactor()] }, { fillColor: "#555", strokeColor: "#555", highlightFill: "#333", highlightStroke: "#333", data: [randomScalingFactor(), randomScalingFactor(), randomScalingFactor(), randomScalingFactor(), randomScalingFactor(), randomScalingFactor(), randomScalingFactor()] } ] }; window.onload = function () { var ctx1 = document.getElementById("barchart").getContext("2d"); window.myBar = new Chart(ctx1).Bar(barChartData, { responsive: true }); } </script> |
Notice:
To use any type of the chart you must also include the following scripts:
|
1 2 |
<script src="../../assets/js/charts/Chart.min.js"></script> <script src="../../assets/js/charts/init.js"></script> |