Present the statistics with HTML and Javascript bar charts.
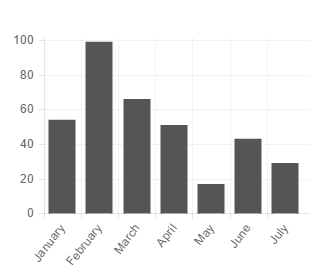
Bar chart
Use the following HTML markup to initialize bar charts:
|
1 |
<div class="col-sm-3"><canvas id="barchart" height="250" width="300"></canvas></div> |
Bar Charts require the following scripts – don’t forget to attach them to HTML page:
|
1 2 3 4 5 6 7 8 9 10 11 12 13 14 15 16 17 18 19 20 21 22 23 24 25 26 27 28 29 30 31 32 33 34 35 36 |
<script src="../assets/js/charts/Chart.min.js"></script> <script src="../assets/js/charts/init.js"></script> <script> var randomScalingFactor = function () { return Math.round(Math.random() * 100) }; var barChartData = { labels: ["Samsung", "Nokia", "Motorola", "Sony", "Apple"], datasets: [ { fillColor: "#D0E0EB", strokeColor: "#D0E0EB", highlightFill: "#BBC9D3", highlightStroke: "#BBC9D3", data: [randomScalingFactor(), randomScalingFactor(), randomScalingFactor(), randomScalingFactor(), randomScalingFactor()] }, { fillColor: "#555", strokeColor: "#555", highlightFill: "#333", highlightStroke: "#333", data: [randomScalingFactor(), randomScalingFactor(), randomScalingFactor(), randomScalingFactor(), randomScalingFactor()] } ] }; window.onload = function () { var ctx1 = document.getElementById("barchart").getContext("2d"); window.myBar = new Chart(ctx1).Bar(barChartData, { responsive: true }); } </script> |
Here you will find more about Charts structure and options.